
.NET Internals: The Profiling API
Click here to download the files associated with this article.
If you find this article useful then please consider making a donation. It will be appreciated however big or small it might be and will encourage Brian to continue researching and writing about interesting subjects in the future.
Tucked away in a dark corner of the .NET Framework SDK is some documentation on an API that lets you find out lots of useful information about the behaviour of your .NET applications. The API lets you dynamically obtain many different types of information as your applications execute, using a well structured and reasonably straightforward approach. It enables you to build execution flow trace tools, code timing tools, exception analysis tools, memory usage analysis tools, hotspot and bottleneck identification tools to name but a few.
This paper introduces the Profiling API, a part of .NET that has not yet received the coverage it rightly deserves. It certainly deserves to be better known due to the power it imparts on the developer. Before looking at the Profiling API we start by briefly looking at the more traditional mechanism for extracting metrics from .NET applications as they execute.
Note: coverage of certain system settings assumes you are working on an NT-based platform, particularly either Windows 2000, Windows XP or Windows Server 2003. This should be a safe assumption as the .NET Framework SDK is not supported on Windows 95, Windows 98 or Windows Me, although it should be noted that the .NET Framework itself is supported on Windows 98 and Windows Me.
There are many aspects of your programs behaviour that could be useful to be informed of. The traditional advice for finding information about running .NET applications, such as memory consumption, JIT behaviour, processor usage, etc. is to use performance counters.
Certainly if you search the .NET Framework SDK documentation for the word "profiling" you will be mostly directed to the use of performance counters through the System.Diagnostics.PerformanceCounter and System.Diagnostics.PerformanceCounterCategory classes. There is scant reference to the Profiling API in the regular documentation; the only exception is a single page that specifies how to enable a profiler written using the Profiling API.
According to the documentation, performance counters can be used to monitor everything from memory management to just-in-time (JIT) compiler performance. They tell you about the resources your application uses, which is an indirect measure of your application's performance. You use these counters to understand how your application works internally rather than to directly measure your application's performance. Various Windows services offer performance counters to provide information in a wide variety of areas and .NET adds many more to the list.
From unmanaged Win32 applications you can access performance counter information by querying the Windows registry or by using the PDH (Performance Data Helper) library. Unfortunately for Delphi programmers there is no import unit supplied with Delphi for the PDH library.
As mentioned above, managed applications can access performance counters using the System.Diagnostics.PerformanceCounter and System.Diagnostics.PerformanceCounterCategory classes.
Performance counters are categorised by the performance object that implements them. To access a performance counter in a performance object you refer to it as \object\counter or \\machine\object\counter (you can access performance counters on other machines).
The list of .NET-related performance counters available on my Windows 2000 machine running .NET 1.1 is as follows:
As you can see, the list is vast and varied and so there is a lot of scope for extracting useful information at selected points in your application run.
Note: performance counters are supported only on Windows NT-based platforms.
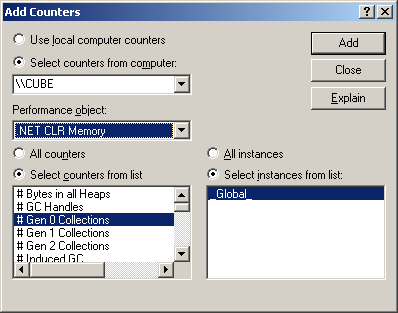
Windows NT-based systems include a tool called the Performance Monitor, which can be accessed through the Control Panel and also by simply running perfmon.exe. The Performance Monitor is the Microsoft Management Console (MMC) with an instance of the System Monitor Control ActiveX embedded within it. The control allows you to select various performance counters and have their values dynamically plotted onto a graph.
When adding a counter to the graph you are presented with this dialog, listing all performance objects and all available counters within the selected object.
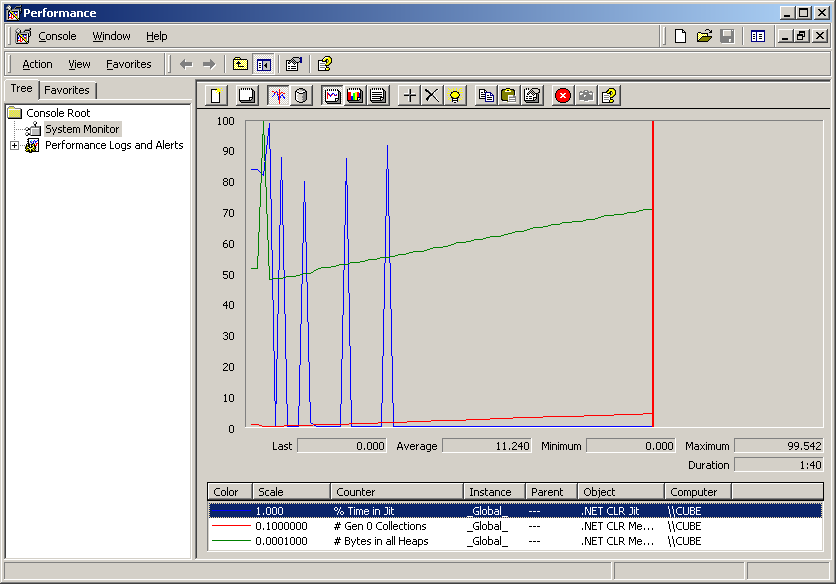
Once you have selected one or more objects the graph will start updating:
Performance counters provide much information but it is difficult to relate the results with the program code unless you use them directly within your application. Sometimes you need more usable information from various applications without adding code to them and this is where the Profiling API comes in.
You can write a profiler that can be used against any arbitrary .NET application without that application knowing it is being profiled. The profiler operates on an event system instead of a polling system (as with the performance counters). As interesting things happen the profiler is immediately notified, and can therefore build up real-time analysis of the profilee (the application being profiled).
The provision of this API is a huge step forward by Microsoft in the effort they are putting into making development of useful tools and utilities much easier. Building profilers for normal Win32 applications is an extremely difficult task but the profiling API makes doing the same for .NET almost a triviality.
The first thing you need to appreciate with the Profiling API is that it is all based around COM interfaces. Whilst many pundits will have you believe that with the advent of .NET COM is dead and that if you do not yet know COM you should not bother learning it, .NET profilers must be built as in-process COM servers. This means we can write .NET profilers in any COM-capable unmanaged language such as Delphi.
The profiler must implement an interface defined by the Profiling API. This interface has a variety of methods that are triggered like events when interesting things happen. There are many of these events in the interface and the profiler specifies which groups of events it is interested in receiving. Doing this avoids having every event repeatedly triggered during the profiling session, which may heavily impact the application's performance.
A simple mechanism is employed to indicate to the CLR that profiling is required by a particular profiler. When managed applications are subsequently run the CLR loads the profiler COM server into the managed application's address space, is told which events to fire and proceeds to do so throughout the rest of that application's lifetime.
Note: .NET applications can be multi-threaded and so the profiler is treated as a free-threaded COM server. This means that you must ensure that it is written in a thread-safe manner.
The regular .NET Framework SDK documentation has no coverage of the Profiling API because it is assumed that it is only of interest to tools developers who wish to build profiling tools. Certainly there are a growing number of commercial profilers made available from various tool vendors:
Red-Gate ANTS Profiler: http://www.red-gate.com/code_profiling.htm
AutomatedQA AQTime .NET Edition: http://www.automatedqa.com/downloads/aqnet.asp.
DevPartner Profiler: http://www.compuware.com/products/devpartner/profiler.
Rational Quantify for Windows: http://www.rational.com/products/quantify_nt/index.jsp.
Borland OptimizeIt Profiler for the Microsoft .NET Framework: http://www.borland.com/opt_profiler.
SDK documentation for tool developers can be located in a subdirectory below the main .NET Framework SDK directory, which itself may be a subdirectory of a Visual Studio.NET installation. The Framework SDK can be installed by itself or it can be installed implicitly by installing Visual Studio.NET and it ends up in different locations depending on what you did.
Either way, the subdirectory below the Framework SDK directory is called Tool Developers Guide (Reference 1), so you can use Windows Explorer to search for it if you have trouble locating it manually. Below Tool Developers Guide are two directories: docs and samples. As its name suggests docs is the one with the documentation.
There are three key files in this directory (all Microsoft Word documents) that will be of use in building fully functional profilers, each describing various COM interfaces. In order of merit they are:
Profiling.doc
Metadata Unmanaged API.doc
DebugRef.doc
These three documents all serve as references. To find advice on using the APIs you should look at Matt Pietrek's 2001 MSDN Magazine column (see Reference 2) or John Robbins' excellent debugging book (see Reference 3).
In Profiling.doc you will find the description of the callback interface ICorProfilerCallback, which must be implemented by each profiler. This contains 69 methods, each of which is an event, although 3 of the methods will never be called in .NET 1.x (they are there for use in future versions of .NET). Two of these events are special and are always called; the rest are called only if requested (and if the event actually occurs in the managed application).
ICorProfilerCallback is defined using IDL in the file corprof.idl (and also using C in corprof.h) in the Framework SDK include directory. You will find a translation of the interface into Delphi syntax in the unit corprof.pas in the files that accompany this paper. The job of building a profiler involves implementing this large interface and adding code into the appropriate event methods that you arrange to have called.
Here is the interface in full, so far as I have translated it. Notice that the safecall calling convention is employed to avoid having to mess about with HResult result values and also where appropriate the final out parameter has been turned into a function result value.
|
The special event methods are Initialize and Shutdown. Initialize is called as soon as the CLR has initialised and loaded up the profiler, and it is where you request the event categories you wish to be triggered throughout the program run. Shutdown is called as the CLR is closing down during application termination.
Initialize is passed an IUnknown reference to another interface as a parameter, this one being ICorProfilerInfo (also defined in corprof.idl, corprof.h and corprof.pas). This interface (like all of them except the callback interface) is implemented in the CLR and is there to help you get more information when various events trigger, offering you 33 methods to choose from. You should save this reference away so it can be used in the event methods that are subsequently called. For example:
|
Note: both ICorProfilerCallback and ICorProfilerInfo are documented in Profiling.doc.
The various categories of events that can be requested are identified by bitmask constants defined in corprof.pas, which can be combined together using the OR operator:
| Category | Constant from corprof.pas | Immutable |
| AppDomains being loaded/unloaded | COR_PRF_MONITOR_APPDOMAIN_LOADS | No |
| Assemblies being loaded/unloaded | COR_PRF_MONITOR_ASSEMBLY_LOADS | No |
| Modules being loaded/unloaded | COR_PRF_MONITOR_MODULE_LOADS | No |
| Classes being loaded/unloaded | COR_PRF_MONITOR_CLASS_LOADS | No |
| Thread creation/destruction | COR_PRF_MONITOR_THREADS | No |
| Precompiled function location | COR_PRF_MONITOR_CACHE_SEARCHES | No |
| JITted functions being unloaded | COR_PRF_MONITOR_FUNCTION_UNLOADS | No |
| JIT compilation & inlining | COR_PRF_MONITOR_JIT_COMPILATION | No |
| Functions being called and exiting | COR_PRF_MONITOR_ENTERLEAVE | No |
| Exception generation, searching & handling | COR_PRF_MONITOR_EXCEPTIONS | No |
| CLR exception handling | COR_PRF_MONITOR_CLR_EXCEPTIONS | No |
| CLR suspensions/resumptions | COR_PRF_MONITOR_SUSPENDS | No |
| Garbage collection | COR_PRF_MONITOR_GC | Yes |
| Object allocation | COR_PRF_MONITOR_OBJECT_ALLOCATED | No |
| Remoting | COR_PRF_MONITOR_REMOTING | Yes |
| Managed/unmanaged code transitions | COR_PRF_MONITOR_CODE_TRANSITIONS | Yes |
| CCW proxy creation/destruction | COR_PRF_MONITOR_CCW | No |
| All events | COR_PRF_MONITOR_ALL | No |
You initially request the appropriate event categories in ICorProfilerCallback.Initialize by passing the required flags along to the ICorProfilerInfo.SetEventMask method. The Immutable column in the table above indicates whether you can dynamically enable and disable the event category notification arbitrarily at runtime; as you can see certain events can only be requested upon profiler initialisation.
Additional constants are available that control the managed code capabilities, all of which are immutable:
| Constant | Meaning | |
| COR_PRF_ENABLE_REJIT | Enables ability to force methods to be re-JITted via ICorProfilerInfo.SetFunctionReJIT | |
| COR_PRF_ENABLE_INPROC_DEBUGGING | Enables use of in-process debugging interfaces | |
| COR_PRF_ENABLE_JIT_MAPS | Tells CLR to maintain Native to IL maps | |
| COR_PRF_ENABLE_OBJECT_ALLOCATED | Enable use of COR_PRF_MONITOR_OBJECT_ALLOCATED category | |
| COR_PRF_DISABLE_INLINING | Globally disables JIT from using method inlining | |
| COR_PRF_DISABLE_OPTIMIZATIONS | Disables JIT code optimisations |
As an example, to request events that indicate when objects get allocated you might use code like this:
|
To avoid having to implement each of the 69 ICorProfilerCallback methods in every profiler it makes sense to implement a base class to do this. Descendant classes can them implement only the event methods that are important for them, making the actual job of building real profilers a little easier.
Additionally the base class should do any rote work that is needed for every profiler, such as saving the ICorProfilerInfo interface passed into the Initialize method. However doing this in the base class would put a requirement on every profiler to call the inherited Initialize method each time they add extra start-up code in their own overridden Initialize method. To reduce the risk of forgetting to do this the base class introduces two virtual methods, OnInitialize and OnShutDown, which are called by Initialize and Shutdown respectively. New descendant classes override these OnXXXX methods and have no obligation to do anything in particular in them.
A base profiler class called TBaseProfiler is supplied in the unit BaseProfiler.pas. As well as what has so far been described the class declares a DWord field called EventMask, initialised to COR_PRF_MONITOR_NONE. Descendant classes assign appropriate event category constants to this field in OnInitialize and the base class proceeds to request these events after OnInitialize returns.
Additionally TBaseProfiler declares a Windows critical section, CritSec, which is initialised in Initialize and deleted in Shutdown. This can be used by profilers to ensure thread safety in their event methods (remember that .NET profilers are free-threaded COM objects) and this in itself is made easier by the helper methods SyncEnter and SyncExit.
Note: the Profiling API documentation states that there are some methods it is unsafe to block in (i.e. hold up the execution by performing a lengthy process or waiting for something to happen). Generally the advice is not to call into managed code or allocate managed heap when this rule is in place, so waiting for a critical section to become available should pose no problem.
|
You can see in this section of the class that the Initialize and Shutdown methods have conditionally compiled code to make a little double-beep noise as they execute. This gives us a trivial mechanism by which we can tell if a profiler has been loaded, neatly sidestepping the requirement to debug it and set breakpoints. This debug-by-ear technique is used by a number of low-level developers and is promoted by John Robbins (see Reference 3).
The base class actually has more up its metaphorical sleeve, but this is enough for us to get going with building and testing some sample profilers.
You can build a new .NET profiler by making an in-proc COM server project (described in the Delphi IDE as an ActiveX Library, on the ActiveX page of the File | New | Other... dialog). Add the BaseProfiler.pas unit to the library project and then make use of the TemplateProfiler.pas unit as a template to create new profilers from. The unit looks like this:
|
Add it to the project and then save it with a new name (to avoid messing up the original template, leaving it available for future use). Then follow these steps:
Change the name of the class. This is easily done with the Code Explorer; locate the class name, right-click on it and choose Rename.
Modify the ProfilerCoClassName constant. Note that this constant becomes the second half of this COM object's ProgID, the first half being the project name. For example in a project called Profiler.dll, setting ProfilerCoClassName to MyProfiler yields a ProgID of Profiler.MyProfiler. This fact is mentioned here as you will likely be using the profiler's ProgID later to enable its use.
Modify the ProfilerDescription constant to briefly describe the profiler.
Modify the ProfilerGUID constant to be a new, unique GUID to identify the COM object by. You can easily get a GUID using Ctrl+Shift+G in the Delphi editor, but it will need to be tweaked to have the correct syntax by removing the square brackets that will surround it.
Modify the ProfilerClass constant to reflect the profiler's class type.
These constants are used in the initialisation section by the COM object class factory and are required for successful operation.
You are now free to set up an appropriate event mask and start overriding the event methods that will be triggered by the .NET CLR. To give you the idea the supplied SampleProfiler.pas unit contains the TSampleProfiler class, which methods look like this:
|
When a .NET application is executed every class that is loaded from an assembly by the CLR causes a short, random frequency noise to occur. If you were to load a large .NET application, such as the SharpDevelop development environment, you will get a lengthy static-like noise from your speaker. You can get the same behaviour with both Microsoft Visual Studio.NET and Borland C#Builder, despite them not being .NET applications. As soon as you open or create a C# application these environments host a CLR session, since the form designer and Object Inspector are .NET objects.
Of course this sample code is all well and good but we do not yet have the information we need to enable the profiler and test it out.
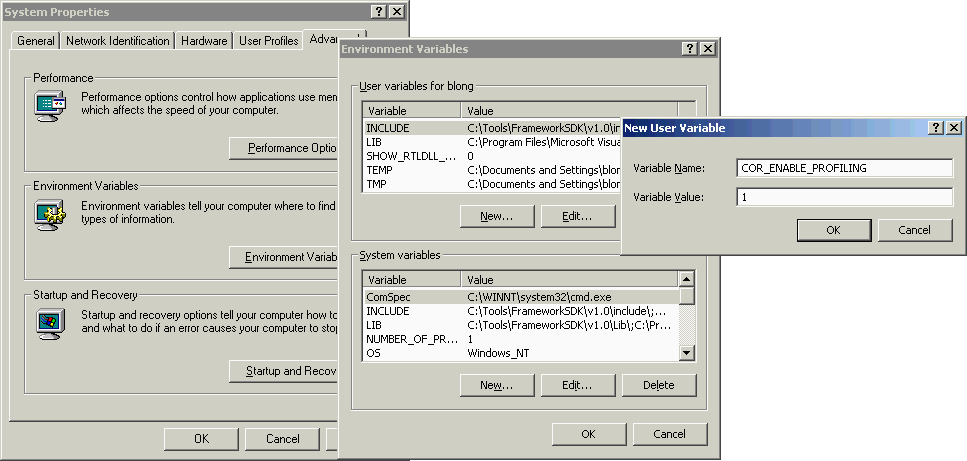
When a managed application starts up, the .NET CLR checks the values of a couple of environment variables to see if a profiler should be loaded up into the process address space before proceeding. These variables are mentioned on the single page in the regular Framework SDK documentation that refers to the Profiling API (the Enabling Profiling page in the Debugging and Profiling Applications section).
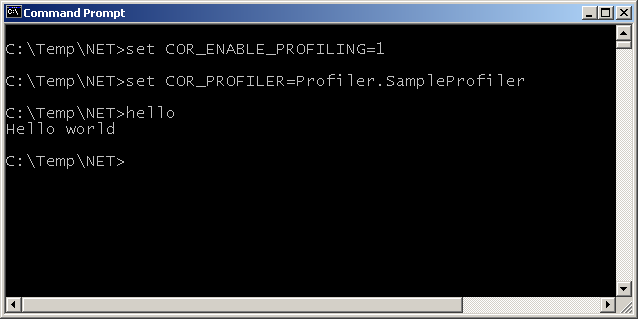
To inform the CLR that profiling is required you set the COR_ENABLE_PROFILING environment variable with a value of 1. To indicate which profiler should be loaded you set COR_PROFILER to either the ProgID or the ClassID of the profiler object.
To profile a single application you can set these variables from a command prompt and then launch your application from there. It will then be profiled, as will any other .NET applications you launch in the same session (unless you set COR_ENABLE_PROFILING to 0 or to a blank value).
For example to enable the sample profiler from above using its ProgID, and profile a trivial Hello World type application, you could do this:
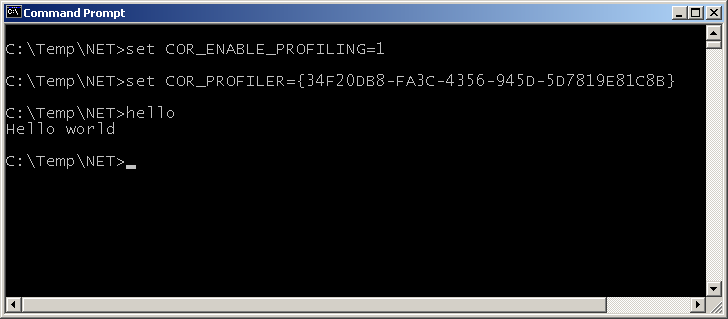
To enable it using its ClassID you could do this:
To enable profiling of all .NET applications you could set the environment variables globally using the System Properties dialog. You can access this from Control Panel (the System applet), your Windows desktop (right-click on My Computer and select Properties, or select My Computer and press Alt+Enter) or from anywhere by using the Windows key in conjunction with Break or Pause (Windows+Break).
On the Advanced page there is an Environment Variables... button that lets you add variables for all user accounts (the System variables group) or for the current user account (the User variables group).
Note: in order to profile ASP.NET applications, which are loaded into IIS whose environment would be very tricky to modify, you are obliged to set global environment variables to enable profiling.
When you use global environment variables every .NET application will be profiled by your profiler. You can alter this default behaviour using various schemes. For example you could have your profiler use an INI file that lists the applications it should profile. When the profiler starts up it can examine the process it is loaded into and compare it with the list. If it is loaded into an application that does not need profiling then it can leave the EventMask profiler field set to COR_PRF_MONITOR_NONE, thereby making its presence have no effect on the application.
You could alternatively use registry settings or even your own environment variable to achieve the same effect; environment variables can be read using the GetEnvironmentVariable routine in the SysUtils unit (added in Delphi 6) or the GetEnvironmentVariable Win32 API.
When developing a .NET profiler in Delphi you will naturally need to debug it from time to time. This can be accomplished quite straightforwardly in the same way you debug any normal DLL but there a couple of caveats (we'll look into those in a moment).
The application you wish to profile should be entered as the Host Application in the Run | Parameters... dialog.
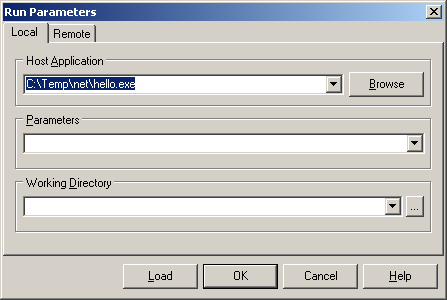
When you press F9 (or choose Run | Run) in the IDE, the managed executable will be launched and will load your profiler into its address space. However that will only happen if the program has the two key profiling environment variables set in its environment.
You can ensure this is the case by either setting the variables globally or by setting them in a command prompt that is then used to manually launch the IDE. The IDE will get those environment variables in its own environment and will pass them onto the program being debugged.
However a better way is to use the new Environment Variables page in the environment options dialog (added in Delphi 6). This lets you specify a custom environment for applications launched from the IDE, which is a much simpler way to get what we require.

With that issue dealt with we can now look at the other one. A problem with the Delphi debugger means that typically when you wish to debug an in-process COM server loaded into a host application your initial attempts will be destined to complete failure. For some reason the debugger insists on you setting the Include remote debug symbols option on the Linker page of the project options dialog. This causes the linker to generate a big symbol file (named after your project with an .rsm extension) and then breakpoints, stepping and so on work fine in the IDE.
When building anything other than a trivial profiler you will want more information from each event method that gets called. If you examine the various methods in ICorProfilerCallback you will see that most of them receive some form of ID parameter that identifies the item to which the event relates:
AppDomain events receive an appDomainId
assembly events receive an assemblyId
module events receive a moduleId
class and CCW events receive a classId
JIT and managed/unmanaged transition events receive a functionId (or callerId and calleeId, which are the same thing)
thread events receive a threadId or unmanagedThreadId
GC events can receive an objectId
exception events receive an objectIds or a functionIds
All these ID values are actually the memory addresses of the item in question. However since the layout of each item is undocumented they should be treated as opaque handles that identify an individual class or object or module etc.
The ICorProfilerInfo interface has various methods that can be used to turn an ID into something more useful such as a name, and the TBaseProfiler class implements a variety of helper methods that will do the hard work of translating various IDs into textual names. The job of translating appDomainIds, assemblyIds and moduleIds into names is reasonably straightforward thanks to the ICorProfilerInfo interface methods GetAppDomainInfo, GetAssemblyInfo and GetModuleInfo.
|
Managed threads don't have names so there is nothing much you can do with a threadId so the remaining translation task involves finding the class name from a classid or an objected, and finding the class and method names from a functionId.
Unfortunately the ICorProfilerInfo interface doesn't offer enough to complete these jobs on its own. The best it can offer for the classId is GetClassIDInfo, which will give you the moduleId of the module containing the class as well as a metadata token for the class. For an objectId it does offer the GetClassFromObject method that returns the classId for the object's class type, but again you can only get a metadata token from that. In the case of the functionId it offers GetTokenAndMetaDataFromFunction, which returns a metadata token for the method.
In order to make use of these metadata tokens we need to resort to another API, the Unmanaged Metadata API. In particular we need to IMetaDataImport interface from cor.h (translated in cor.pas), which is documented in Metadata Unmanaged API.doc. IMetaDataImport allows you to manipulate metadata in a managed assembly with its 62 methods.
As well as supplying a metadata token for the method, the ICorProfilerInfo.GetTokenAndMetaDataFromFunction method returns an IMetaDataImport interface. You can then use IMetaDataImport.GetMethodProps to readily turn the metadata token into the method name.
In the case of finding a class name there is an extra step. ICorProfilerInfo.GetClassIDInfo gives you a class metadata token and a moduleId but no IMetaDataImport interface. For that you need to pass the moduleId into ICorProfilerInfo.GetModuleMetaData. With the returned IMetaDataImport interface you can then call its GetTypeDefProps method to extract the class name.
|
You might notice that all of these ID translations methods have an exception handler to hide any exceptions that might occur. The reason for this is that the Profiling API interface methods are all declared using the safecall calling convention and so if any error-indicating HResult is passed back they will raise an EOleSysError exception with the HResult stored as the exception's ErrorCode property.
If you try and translate one of the IDs into a name before the CLR has fully loaded its information you will indeed get a bad HResult causing an exception so the code hides these problems. In particular, trying to get the name of an assembly when it has started loading, but before it has finished loading will generate error CORPROF_E_DATAINCOMPLETE or $80131351 (the ID is not fully loaded/defined yet).
You should take note that there are a variety of possible HResult error return codes that could cause exceptions to occur in your profiler code, so be warned! You can find a list of the definitions of these errors in the C header file CorError.h (translated into cor.pas):
|
A more realistic sample profiler is supplied as TLoggingProfiler in LoggingProfiler.pas. This implements most of the profiling event methods, turns the ID parameter into something more useful and logs a string describing the event. Here is a selection of the event methods from this profiler:
|
You can see by examining the content of some of the above methods that the breadth of information supplied to profilers is wide and varied. You might also note that all the methods log their event details using the Log method. Log is another helper method (actually a pair of overloaded methods) in the base profiler class TBaseProfiler. It currently operates by building up a string using Format and passing it to the OutputDebugString API but this could readily be changed to support logging to a file, for example.
The methods also make use of a NestingLevel variable to try and indicate events that occur during some other operation. When, say, an assembly starts being loaded the nesting level is incremented (i.e. the output will be indented) and when the assembly stops loading the nesting level is decremented (unindented).
Debug strings generated by a program running within a debugger will be picked up by the debugger. In the case of the Delphi IDE you must ensure you have the Output messages option is enabled on the Event log page of the debugger setting dialog (Tools | Debugger Options...).
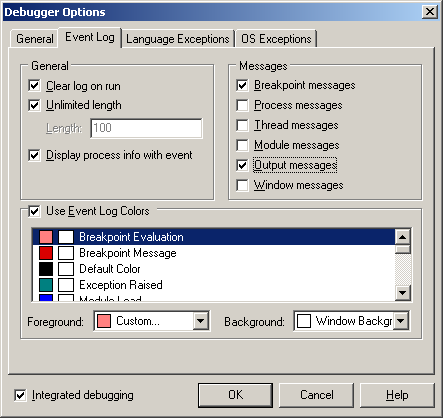
If it is set then you will see the messages in the Event Log:
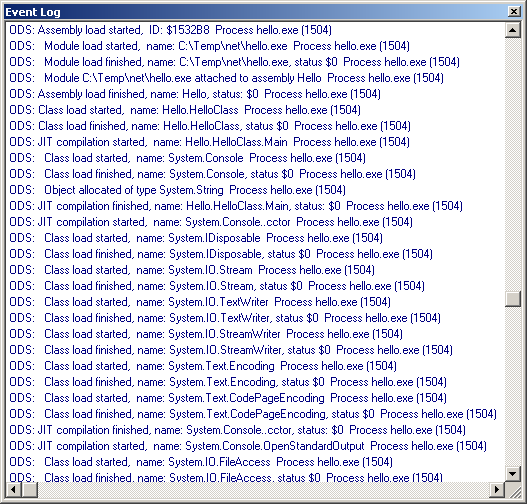
You can just about see the nesting going on in the Event Log window, but it is a bit difficult due to the font used. You also tend to get a bit of "noise" in the Event Log; each debug string is prefixed with ODS (as in OutputDebugString) and suffixed with the information about the process name and process ID.
When running an application either outside the IDE, or from within Delphi but with IDE Debugging disabled (see Reference 4 for an article that shows how to reveal a hidden menu item to do this automatically) you can still keep an eye on debug strings using DebugView, one of a number of great system utilities available from http://www.sysinternals.com.
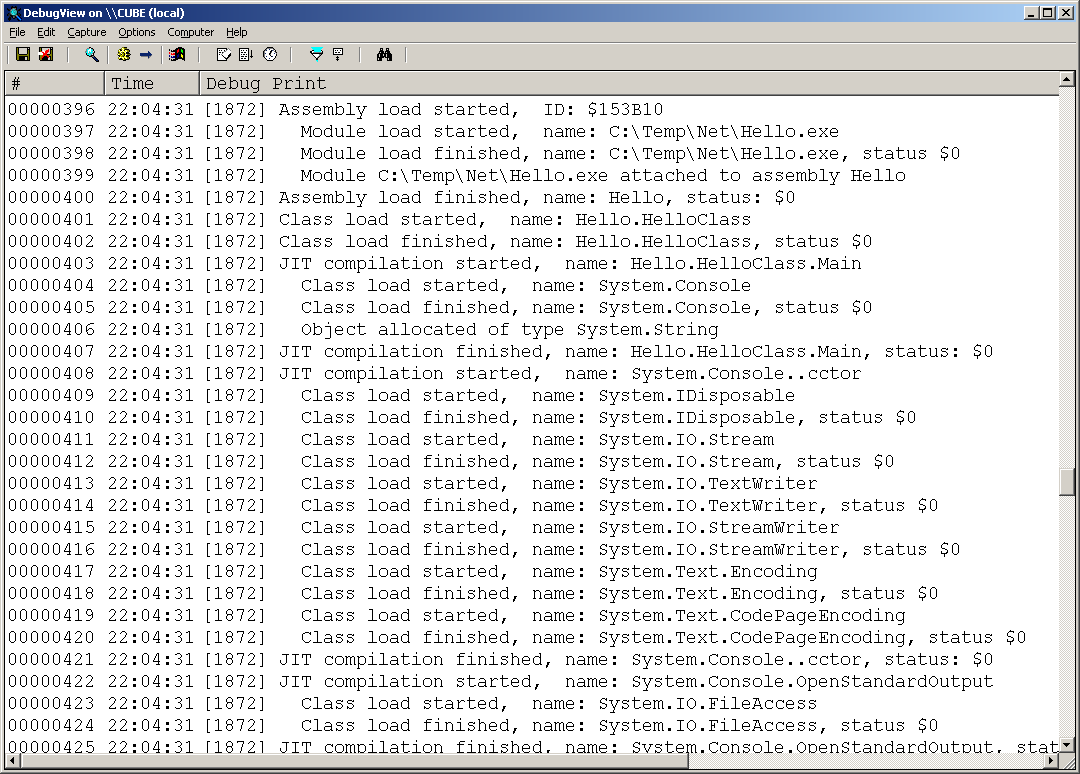
Now you can see the nesting a lot more clearly. The implementation of the Log methods is reasonably straightforward as shown below. The code shows that the nesting level value is doubled and that many spaces are placed before the output message in the debug string. Also, to ensure DebugView picks up the strings correctly the code is careful to append a line feed character to every one of them.
|
Since .NET applications have multiple threads (for example the garbage collector uses a separate thread to run object finalizers on, as detailed in Reference 5) it is useful to be able to identify events happening on different managed threads. In this example I took steps to ensure that each thread could record its own log output nesting level. The simple approach taken in this case is to have the NestingLevel variable declared in thread-local storage (TLS):
|
This means that no matter how many different threads call into the profiler each one has their own copy of the nesting level variable.
Note: this approach of using TLS in the profiler object to support the different managed threads works fine in .NET 1.x, since there is a one to one correspondence between a managed thread and a Win32 thread; any managed thread will run on exactly one Win32 OS thread. However in future versions of .NET this is unlikely to be the case, which is why there is an event called ThreadAssignedToOSThread.
Currently this event is called exactly once for each managed thread, but in the future it may be called several times. The upshot of all this is that the threadvar solution in the sample is a simple, short-term option that will fail to work correctly in future .NET releases.
For a long-term solution you should allocate some data structure for each managed thread during the ThreadCreated event and dispose of it during the ThreadDestroyed event. You can then use ICorProfilerInfo.GetCurrentThreadID to identify which managed thread is active at any given time.
Another profiler is supplied as TExceptionProfiler in ExceptionProfiler.pas. This example logs details about all exceptions that occur in a .NET application using all the available exception-related events. Here is a portion of the class:
|
And here is some output from the profiler:
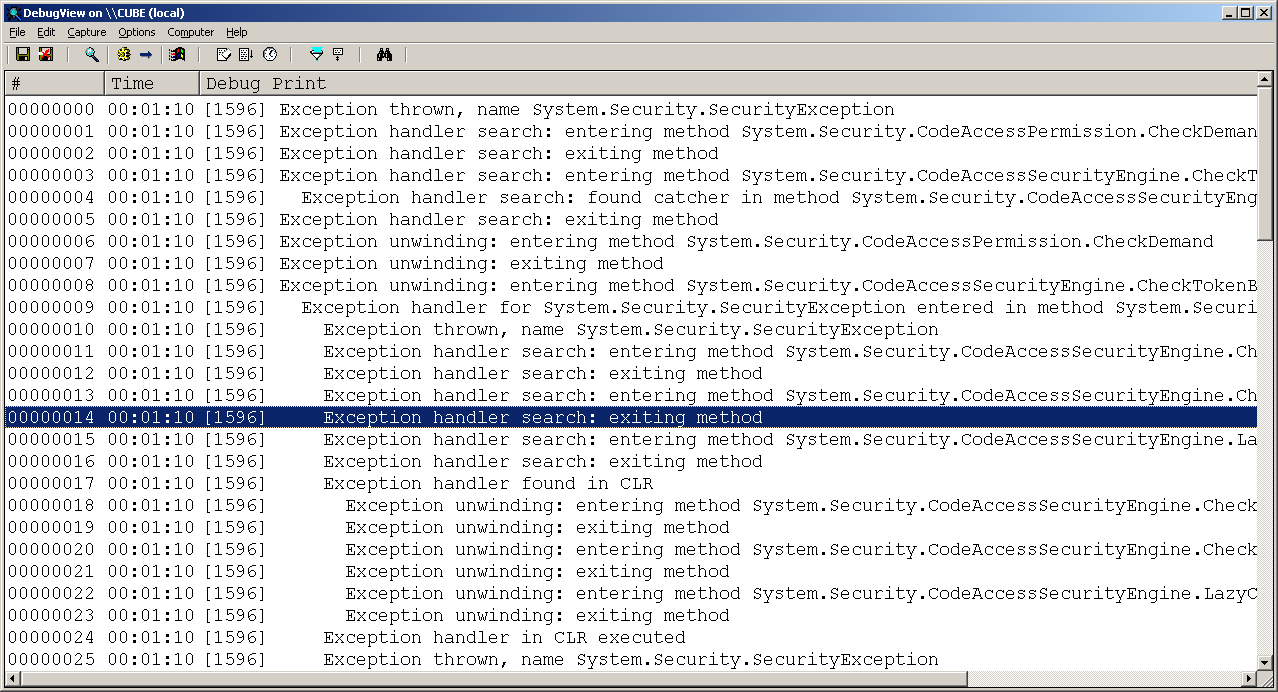
This could be improved by producing a stack trace at the point the exception is thrown. This is very achievable using the Debugging API (documented in DebugRef.doc) but is beyond the scope of this paper.
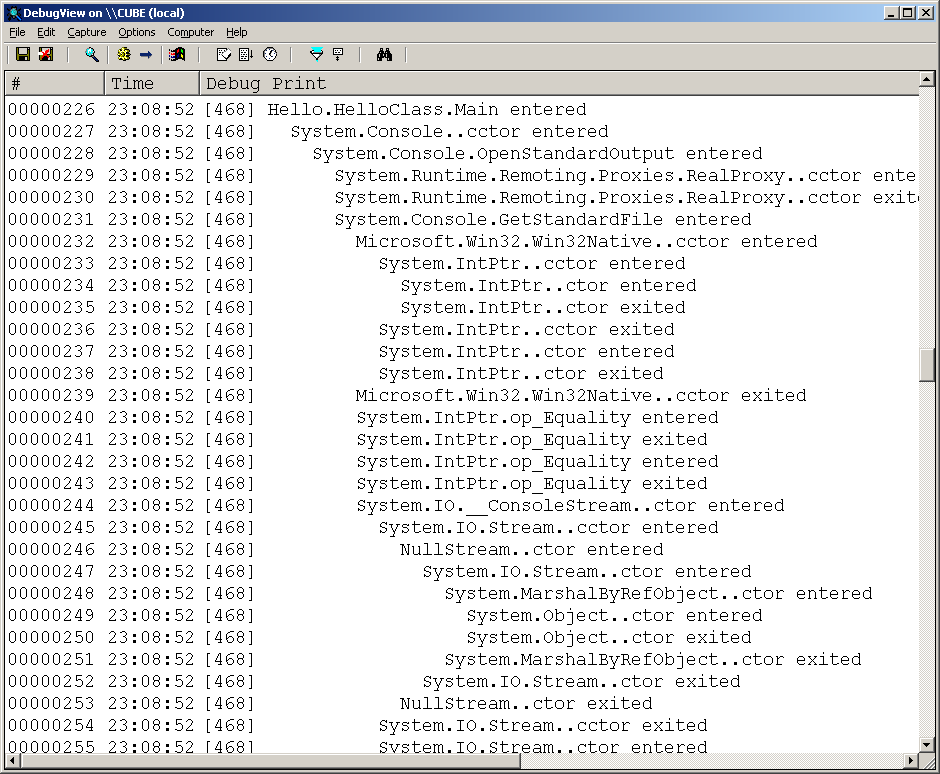
Another example profiler is a function call trace profiler, which allows you to see the flow of execution through your .NET application as one function calls another, which calls some others and returns and so on. If you were paying attention earlier on when we saw the list of event methods in ICorProfilerCallback you might have noticed a distinct lack of events for tracing function calls. However by the same token there is a profiler constant for tracing functions as the execution flow enters and leaves them (COR_PRF_MONITOR_ENTERLEAVE). So how does this aspect of profiling operate?
In order to set up function tracing you need to call ICorProfilerInfo.SetEnterLeaveFunctionHooks. This routine takes three arguments, each of which is a reference to a standalone event routine you must create. The first one is called when a method is entered, the second when it is exited and the third when it is exited in an optimised way using a tail call. This last optimised method exit mechanism is not currently used in .NET 1.x and so the function can be a simple stub if you wish.
Each of the routines will be passed a functionId, which is passed according to the stdcall calling convention. Not only must these event routines be standalone, but according to the documentation they must be declared in a special way. In C++ they must be declared as __declspec(naked), which means the compiler will generate no prolog or epilog code (the code that sets up the stack before the routine executes and tidies it away afterwards). Additionally the routines must preserve any CPU registers they use and restore them before returning.
In short we need to write some assembly code, but if we plan things correctly we only need to write it once. This is the basic structure of a truly naked Delphi routine that fits the bill:
|
There are a few things to note about the code:
the assembler directive is used to discourage Delphi from generating any prolog or epilog code
there is no parameter declared, as that would force Delphi to do a little extra setup work with prolog/epilog code
since there is no epilog code we must subtract the number of bytes from the stack occupied by the functionId parameter, which is a 4 byte unsigned integer.
the assembler code saves the three key registers by pushing them on the stack and then pops them of before exiting
We can get this routine to call a regular Delphi routine if desired, but we need to pass the functionId to it. That normally translates to pushing it onto the stack for most calling conventions but the Delphi default register calling convention passes the first three arguments in registers if they fit. The first argument is passed in EAX, the second in EDX and the third in ECX.
At the start of the routine the parameter is 4 bytes above the stack pointer, since the stack pointer points just past the last thing pushed on the stack and the stack operates in a top-down manner (it fills up from higher memory addresses and the stack pointer is decremented accordingly as this occurs). After pushing the three 4-byte registers it ends up 16 (or $10) bytes above the stack pointer so the code would look like this:
|
We can take this a bit further if we like by calling a method of the profiler class. You may know that in a method Self is actually a hidden parameter. It is the first parameter and so needs to be passed in EAX, meaning the functionId would be passed in EDX as the truly second parameter, but what will look like the only parameter when the method is written out in high-level Delphi. So the following code would call a method called FuncEnter that was compiled with the register calling convention, assuming Profiler is a global variable holding the profiler instance.
|
Another alteration we can make is to add the parameter declaration back into this naked routine. This will cause the compiler to generate prolog code that sets up a stack frame, so the parameter can be referenced by name and also tidy up the stack in the epilog code, but testing shows this does not seem to cause a problem for .NET applications:
|
This is the pattern for each of the three naked routines, meaning we can declare our own event methods to trace function calls:
|
These sample profilers should give you a flavour of what you can do with the profiling API, but they only scratch the surface at present. The following short sections contain some ideas that you might wish to use to improve the samples and move towards a realistic profiling tool.
Currently every ID is converted to a name by negotiating with the ICorProfilerInfo and IMetaDataImport interfaces every time it is required. It is more common to record information about each ID as the item it represents is loaded/created. That way information about the ID can be retrieved locally when it is given to an event method on subsequent occasions, hopefully improving performance and thereby reducing the profiler's impact on the profilee.
There are caveats to this; primarily you need to take great care with objectIds. Since an objectId is the address of the object then a garbage collection sweep can render many objectIds meaningless. You can use the MovedReferences garbage collection event to identify which objects have moved and update your record of their objectIds accordingly.
The sample profilers would be more practical if they logged their output to a file. In the case of different managed threads executing in managed applications each thread's output could be directed to a separate file to keep them all separate.
The execution flow tracing profiler could be made a practical tool by adding in code to perform timing of various operations, such as time spent in each method. This way you could identify the hotspots in your application and concentrate your efforts on looking at improving your coding and algorithms used in those methods.
This paper has looked at the .NET Profiling API, a rich support network for receiving a multitude of diverse events from your .NET applications. Whilst only showing a few simple examples this paper should still give you a strong indication of the power of this API and what you can do with it without much effort.
The supplied profiler framework makes implementing new profilers a very quick exercise, and you are encouraged to develop the samples further.
The .NET Framework SDK Tool Developer Guide documentation
directory.
Wherever the .NET Framework SDK has been installed this is the Tool
Developers Guide\docs subdirectory. Pertinent documents are Profiling.doc,
Metadata Unmanaged API.doc and DebugRef.doc.
The .NET Profiling API and the DNProfiler Tool, Matt Pietrek, MSDN Magazine December 2001, http://msdn.microsoft.com/msdnmag/issues/01/12/hood/default.aspx.
Debugging Applications for Microsoft.NET and Microsoft Windows Chapters 10 & 11, John Robbins, Microsoft Press.
Undocumented Delphi IDE Features, Brian Long,
http://www.blong.com/Undocumented/IDEFeatures.htm.
Includes information on how to use a normally hidden IDE menu item in Delphi
6 and 7 that allows you to run applications with IDE debugging disabled.
Object Destructors and Finalizers in .NET Using C#
and Delphi for .NET, Brian Long, http://bdn.borland.com/article/0,1410,29365,00.html.
This in-depth article looks at the role and usage of destructors (or equivalent)
in the managed world of .NET. It examines in detail the areas of garbage
collection, finalizers, the dispose pattern and language specifics, and
uses both C# and Delphi for .NET for source examples .
Brian Long used to work at Borland UK, performing a number of duties including Technical Support on all the programming tools. Since leaving in 1995, Brian has spent the intervening years as a trainer, trouble-shooter and mentor focusing on the use of the C#, Delphi and C++ languages, and of the Win32 and .NET platforms. In his spare time Brian actively researches and employs strategies for the convenient identification, isolation and removal of malware. If you need training in these areas or need solutions to problems you have with them, please get in touch or visit Brian's Web site.
Brian authored a Borland Pascal problem-solving book in 1994 and occasionally acts as a Technical Editor for Wiley (previously Sybex); he was the Technical Editor for Mastering Delphi 7 and Mastering Delphi 2005 and also contributed a chapter to Delphi for .NET Developer Guide. Brian is a regular columnist in The Delphi Magazine and has had numerous articles published in Developer's Review, Computing, Delphi Developer's Journal and EXE Magazine. He was nominated for the Spirit of Delphi award in 2000.